|
|
|
|
|
|||
|
|||
|
|
|
|
|
|
|
|
|
 |
 |
|
|
|||
| Red Hat Documentation |
 |
Initializing a target executable fileOpen the Console
window, either from the View menu, or
with the Console button (see Console
button).
With the Console
window active, determine if the target file is in the same directory as
Insight. If not, change to the target directory, using the cd
command.
In
our example procedures, the syntax uses the forward slash as the path delimiter
on all platforms. Windows, though, requires using two forward slashes after
the drive designation.
If the source
files are not in the same directory as the executable file, use the GDB
dir
command to add a path to them, using the same syntax as in Step 2 of initializing
a target file. This was not needed in our example.
Use the command, file
example, to specify the target executable file.
See
Console
window with initial commands for the results of these procedures.
Starting Insight from Source-NavigatorThe following steps show how to have
an active Source-Navigator session and start Insight for debugging a project
with that active session.
1.
To start Insight using Source-Navigator,
on Windows operating systems, use the Start menu’s Programs menu item to
locate Source-Navigator and, from a command shell on UNIX systems, enter
“./snavigator” as input. Source-Navigator activates.
From the File
menu, choose the New Project... menu item
to create a new project.
From the File
menu, choose the Project menu item’s Project
Preferences sub-menu item to set debugging preferences.
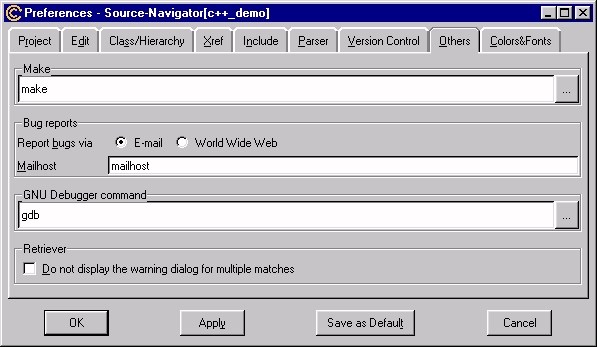
With the Preferences
window active, choose the Others tab.Enter
the path to Insight in the GNU Debugger command
dialog box (see Figure 71 for the results
of this process). Click the OK button
to close the Preferences window.
 Selecting a source file1.
Select a source file (‘foo.c’ in the example, Source file and function selection) from the file drop-down combo box, at the bottom of the Source Window. Source file and function selection represents the lower left corner of the Source Window, showing the Source Windowfile menu drop-down combo box on the left and the function drop-down combo box on the right of the window. See also Below the horizontal scroll bar. Figure 72: Source file and function selection2.
Select a function from the function drop-down combo box, at the bottom of the Source Window (in Source file and function selection, ‘foo’ is the choice), making the source file (in this example, ‘foo.c’ ) display in the Source Window with a colored bar (in Source Window with foo.c source file, on the first executable line, line 6, in the ‘foo’ function, the colored bar is violet), indicating that the program is not running. Figure 73: Source Window with foo.c source fileSetting breakpoints and viewing local variablesA breakpoint
can be set at any executable line in the source file (as in ‘main.c’ of
our example executable program, shown in Results
of setting breakpoints at lines 6, 7, 8, and 9). Executable lines are
marked by a minus sign in the left margin of the Source
Window. When the cursor is in the left column and it is over an
executable line, it changes into a circle. When the cursor is in this state,
a breakpoint can be set.
The following
exercise steps you through setting four breakpoints in a function, as well
as running the program and viewing the changing values in the local variables.
1.
With the Source Window active, having opened the foo.c source file, place the cursor over the minus sign on line 6. 2.
When the minus sign changes into a circle, click the left mouse button; this sets the breakpoint, signified as a red square. 3.
Repeat the process to set breakpoints at lines 8, 9 and 10. See Results of setting breakpoints at lines 6, 7, 8, and 9. 4.
Open the Breakpoints window, by clicking the Breakpoints button on the tool bar (see Breakpoints button and Breakpoints window). Figure 74: Breakpoints window  5.
Click the check box for line 6. The red checkmark disappears and the red square in the Source Window changes to black. This color change indicates that the breakpoint has been disabled. Re-enable the breakpoint at line 6 by clicking the check box. 6.
Click the Run button on the tool bar to start the executable (see Run button). The program runs until it hits the first breakpoint on line 6. The color bar on line 6 is green, indicating that the program is running (see Results of setting breakpoints at lines 6, 7, 8, and 9 and Breakpoints window). Figure 75: Results of setting breakpoints at lines 6, 7, 8, and 9Figure 76: Breakpoints window7.
Open the Local Variables window, by clicking the Local Variables button in the tool bar (see Local Variables button and See Local Variables window). The window displays the initial values of the variables. 8.
Click the Continue button in the tool bar (see Continue button), to move to the next breakpoint. The variables that have changed value turn blue in the Local Variables window (see Local Variables window after setting breakpoints). Figure 77: Local Variables window after setting breakpoints9.
Click the Continue button two more times, to step through the next two breakpoints and notice the changing values of the local variables. Setting breakpoints on multiple threadsWith Insight, in a multi-thread environment, select threads and set breakpoints on one or more threads.Warning!1. In the Source Window, right click on an executable line without a breakpoint to open the breakpoint pop-up menu (see Figure 77). Figure 77: Breakpoint pop-up menu in the Source Window 
2. Scroll down to the bottom of the program in the Threads window and select Set Breakpoint on Thread(s) from the pop-up menu. The Thread Selection dialog box opens (see Figure 78). Figure 78: Thread Selection dialog box 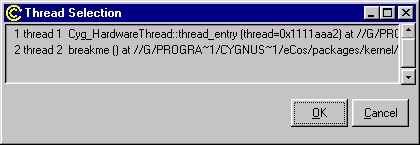
3. By clicking, select one or more threads. A breakpoint at the executable line sets only for selected threads. 4.
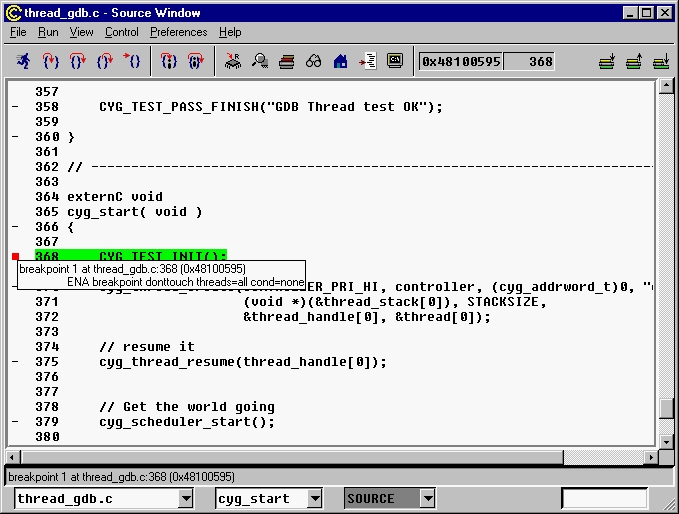
Figure 79: Breakpoint
information balloon with thread information
|
|
|
© 2001 Red Hat, Inc. All rights reserved. About Red Hat : Legal statement : Privacy statement : Y2K statement : Contact Red Hat |