When Insight
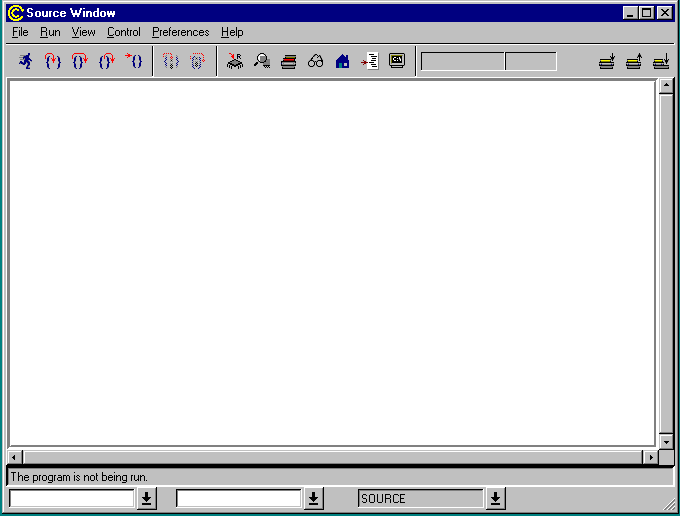
first opens, it displays the Source
Window. The other windows that are invoked from the Source
Window, through View menu selections
or tool bar buttons have documentation in the order that they appear in
the Source Window's View
menu. The Help window, for instance, is
invoked from the Source Window's Help
menu.
The documentation
discusses what occurs during an actual debugging session, after running
the executable up to a single breakpoint set in 'main.c' of our
example executable program.
Source
Window
When Insight
first opens, it displays the Source Window
(see Source
Window).
The following
documentation describes the Source Window
attributes and its correlating functionality.
Displays About GDBTk
window, containing product version number, copyright and Cygnus contact
information for Insight.
Toolbar
buttons
Run / Stop
Figure
8: Run button
The Run
button runs the executable. During execution the button turns into the
Stop button. If you click on the Run
button with no executable loaded, you invoke the Target
Selection dialog box. See Target
selection from the Source Window.
Figure
9: Stop button
The Stop button will interrupt
the program, provided that the underlying hardware and protocol support
such interruptions. Many monitors that are connected to boards cannot interrupt
programs on those boards, so the Stop button has no functionality.
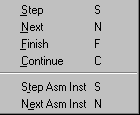
Step
Figure
10: Step button
Steps to next executable line
of source code. Steps into called functions.
Next
Figure
11: Next button
Steps to next executable line
of source code in the current file. Steps over called functions.
Finish
Figure
12: Finish button
Finishes execution of the
current frame.
If clicked while in a function,
it finishes the function and returns to the line that called the function.
Continue
Figure
13: Continue button
Continues execution until
a breakpoint, watchpoint or other exception is encountered; or execution
is complete.
Step assembler
instruction
Figure
14: Step assembler instruction button
Invokes Step
assembler instruction. Steps into
subroutines.
Next assembler
instruction
Figure
15: Next assembler instruction button
Steps to Next
assembler instruction. Executes
subroutines and steps to the following instruction.
The Console
button brings up the Console
window, which features a command line interface to GDB, the GNUPro
debugger.
Line address /
Line number display
Figure
23: Program counter display frame and line number display frame
The left-hand read-only frame
displays the program counter (pc) of the
current frame, while the program is running.
The right-hand read-only frame
displays the line number, which contains the pc,
while the program is running.
Down stack frame
Figure
24: Down stackframe button
Moves down the stack frame
one level.
Up stack frame
Figure
25: Up stackframe button
Moves up the stack frame one
level.
Go to bottom of
stack
Figure
26: Go to bottom of stackframe button
Moves to the bottom of the
stack frame.
Special display pane features
The following
discussion details some special features to the display
panes.
When the executable is running,
the location of the current program counter is displayed as a line with
a green background
When the executable has finished
running, the background color changes to violet (browsing mode).
When looking at a stack backtrace,
the background color changes to golden yellow
Using
the mouse in the display pane
There are various
uses of the mouse within the main display
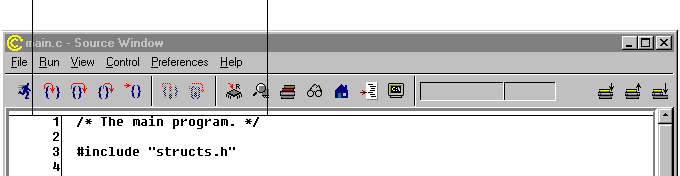
pane of the Source Window. The display
pane is divided into two columns (see Using
the mouse in the window). The left column extends from the left edge
of the display pane to the last character of the line number. The right
column extends from the last character of the line number to the right
edge of the display pane. Within each column, the mouse has a different
set of effects.
Figure
27: Using the mouse in the window
Left display column
| Right display column
Right
display column
By holding the cursor over a global
or local variable, the current value of that variable is displayed.
By holding the cursor over a pointer
to a structure or class, the type of structure or class is displayed and
the address of the structure or class is displayed.
By double clicking an expression,
it is selected.
By right clicking while an expression
is selected, a pop-up menu appears. The selected expression appears in
both menu selections. In Figure
28: Pop-up window for expressions, the selected variable was the 'lis'expression.
Figure
28: Pop-up window for expressions
Add
lis to Watch
Brings up the Watch Expressions
window and adds a variable expression (the 'lis' variable, in
this instance) to the list of expressions in the window.
Dump
Memory at lis
Brings up the Memory
window, which displays a memory dump at an expression, in this instance,
the 'lis'expression.
Left display
column
When the cursor is in the
left column and it is over an executable line (marked on the far left by
a minus sign), it changes into a circle. When the cursor is in this state,
events have the following results:
A
left click sets a breakpoint at the current line. The breakpoint appears
as a red square in place of the minus sign.
A left click on any existing breakpoint
or temporary breakpoint removes that breakpoint.
This causes the program to run up to this location, ignoring
any breakpoints. Like the temporary breakpoint, this menu selection is
displayed as an orange square. This selection disables all other breakpoints.
When a breakpoint has been disabled, it turns from red or orange to black.
Warning:
The debugger might be expected
to execute to a given location, stopping at all encountered breakpoints.
This menu item currently forces execution to this location without stopping
at any encountered breakpoints.
Set
breakpoint here
This sets a breakpoint on the current executable line.
This has the same action as left clicking on the minus sign.
Set
temporary breakpoint here
This sets a temporary breakpoint on the current executable
line. A temporary breakpoint is displayed as an orange square. The temporary
breakpoint is automatically removed when it is hit.
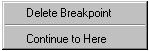
Figure 30: Pop-up menu for deleting
breakpoints
Delete
Breakpoint
This deletes the breakpoint on the current executable
line. This has the same action as left clicking on the red square.
At the top of
horizontal scroll bar, a text box displays the current status of the debugger
(in the status box for the window depicted in Figure
31: Status text box, the message reads "Program
stopped at line 19" as current status for the example's program.
Figure 32:
Drop-down list box
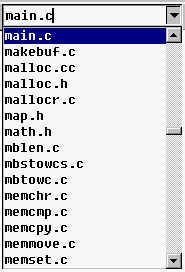
The drop-down
list box displays all the source (.c)
and header (.h) files associated with
the executable. Files may be selected by clicking in the list box, or by
typing into the text field above the list. The
drop-down list box displays all the functions in the currently selected
source or header file. A function may be selected by clicking in the list
box, or by typing into the text field above. For the function
drop-down combo box, the ‘main.c’
file only contains the one ‘main’ function.
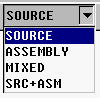
The source code is displayed in the Source
Window.
ASSEMBLY
The assembly code is displayed in the Source
Window.
MIXED
The source code and the assembly code are both displayed,
interspersed in the Source Window.
SRC+ASM
The source code and the assembly code are both displayed
in a double paned window. The source code is displayed in the Source
Window and, in a pane below the source code pane, the assembly code
is displayed.
Figure 35: Search text box
By typing a character string into the search
text box and pressing Enter, a forward
search is done on the source file for the first instance of that character
string. By pressing the Shift and Enter
keys simultaneously, a backward search is done for the string. Repeatedly
hitting Enter or the Shift
and Enter keys simultaneously, repeat
the search forward or backward in the search window. If you type "@"
in the search text box and a number, the source display jumps
to the line of the number specified. For instance, after having specified
"@" and "6"
in the search text box, the example program shows a jump to line 6 in Using
the search text dialog box.
Using
the search text dialog box
Dialog boxes
for the Source Window
The following
documentation describes the dialog boxes that are invoked from the Source
Window, through the File
and Preferences menu
selections.
Load
New Executable dialog box for the Source Window
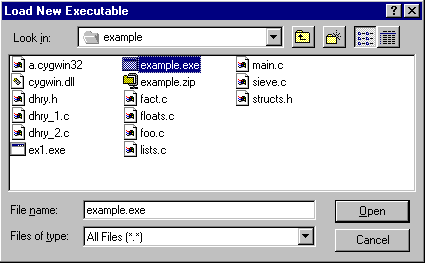
The Load
New Executable dialog box, as shown
in Load
New Executable dialog box window, is invoked by clicking the
Open menu
item in the file drop-down menu of the
Source Window. This dialog box allows
you to navigate through directories and select an executable file to be
opened in the Source
Window.
Figure 35:
Load New Executable dialog box window
Page
Setup dialog box for the Source Window
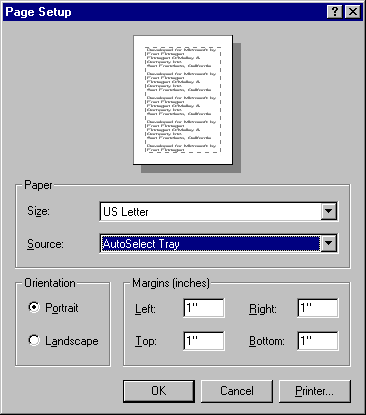
The Page
Setup dialog box, as shown in Page
Setup dialog box window, is invoked by clicking the Page
Setup menu item in the File drop-down
menu for the Source Window. This standard
dialog box allows you to make page layout selections before printing a
source file.
Figure 36:
Page Setup dialog box window
Print
dialog box for the Source Window
ThePrint
dialog box window is invoked by clicking the Print
Source menu item in the File drop-down
menu of the Source Window. This dialog
box allows you to select a printer and make other print specific selections,
before printing a source file.
Figure 37: Print dialog
box window
Target
selection from the Source Window
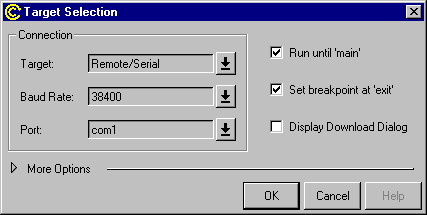
The Target
Selection dialog box is invoked by clicking the Target
Settings menu item in the File
drop-down menu of the Source Window. This
dialog box allows you to select the target you wish to run the executable
on, and make other run-specific selections.
Figure 38:
Target Selection dialog box window
Connection
The Connection group
contains the target drop-down list box for target selection and two other
fields for setting target-specific parameters.
Target
The contents of this list box depend upon the specific
GDB debugger configuration you have received. For a native configuration,
the list contains Exec (for native execution),
Remote/Serial (serial connection to a
remote target) and Remote/TCP (TCP connection
to a remote target).
If
GDB has been configured to include a specific hardware simulator, the target
Exec will be replaced by target, sim.
The names of specific hardware targets may also be included in the list,
with serial, TCP or both methods of connection, depending upon the hardware.
Baud
Rate/Hostname
When a serial connection to a remote target is selected
the baud rate may be set. When a TCP connection to a remote target is selected,
this list box turns into a text edit field, renamed "Hostname,"
allowing for specifying of a host name.
Port
For both serial and TCP connections to remote targets,
the port must be designated. For serial connection, port specifies the
serial port on the host machine. For TCP connections, port specifies the
port number on the remote target.
Run
until 'main'
Set a breakpoint atmain
and run until that breakpoint is reached. This is checked by default.
Set
breakpoint at 'exit'
Set a breakpoint at the call to the 'exit' routine. This
is checked by default.
Display
Download Dialog
In addition to using the status-bar, display more extensive
download status information in a dialog box. This is particularly useful
when doing a serial download to a remote target. This is unchecked by default.
Figure 39:
Target Selection window's Run
Options features
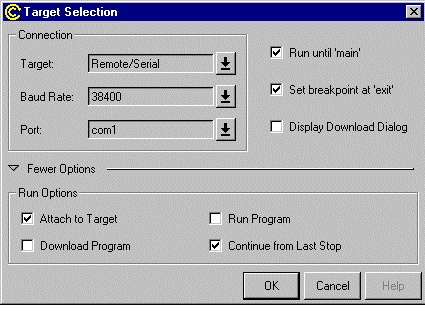
Run
Options
The four check boxes in this group set-up the actions
taken, when the Run button is clicked.
Attach
to Target
Connects to a remote target.
Download
Program
Downloads an executable to a remote target.
Continue
from Last Stop
Continues execution from wherever the executable, on
a remote target, left off.
Run
Program
Begins execution of an executable.
Global
Preferences dialog box for the Source window
The Global
Preferences dialog box, as shown in Global
Preferences dialog box window, is invoked by clicking the Global
menu item in the Preferences drop-down
menu of the Source Window. This dialog
box allows you to select the font and the type size, for displaying text.
Figure 40:
Global Preferences dialog box window
Icons
This drop-down list box allows for
choosing between the default Windows-style icon set as shown in Windows-style
icon set and the basic icon set as shown in Basic
icon set.
Figure 41:
Windows-style icon set
Figure 42:
Basic icon set
Fonts
The fields in this group allow for custom selection of
font family and size.
Fixed
Font
This drop-down list box allows you to select the font
for the source code display panes
Default
Font
This drop-down list box allows you to select the font
for use in list boxes, buttons and other controls.
Status
bar Font
This drop-down list box allows you to select the font
for the statusbar.
Source
Preferences dialog box for the Source window
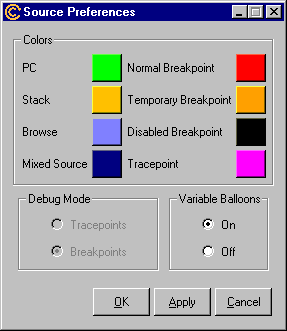
The
Source Preferences dialog
box, as shown in Source
Preferences dialog box, is invoked by clicking the Source
menu item in the Preferences drop-down
menu of the Source Window.
Figure 43:
Source Preferences dialog box
Colors
Single left-clicking any of the colored squares opens
the Choose color dialog box. The Choose
color dialog box allows the display colors to be modified by the
user.
Debug
Mode
Unless GDB has been configured to enable the setting
of tracepoints, this radio button has no effect.
Variable
Balloons
If Variable Balloons
is on, a balloon appears displaying the value of a variable, when the mouse
is placed over the variable in the Source Window.
The default is on.
Stack
window
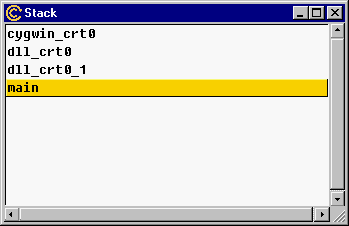
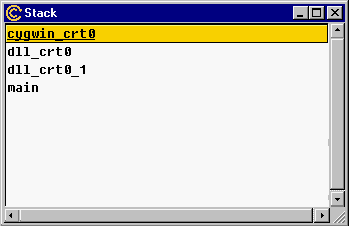
The Stack window
displays the current state of the call Stack, as shown by Stack
window, where each line represents a stack frame.
Figure 44:
Stack window
Clicking a frame
selects that frame, indicated by the background of the frame turning yellow,
as shown in Clicking
a stack frame. The Source Window automatically
updates to display the line, corresponding to the selected frame. If the
frame points to an assembly instruction, the Source
Window changes to display assembly code. The background of the corresponding
line in the Source Window also changes
to yellow.
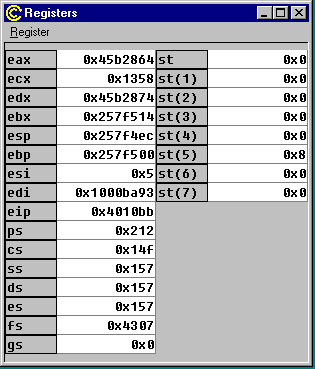
A double click on a register allows
the content of the register to be edited.
Hitting
the escape key (Esc) will abort the editing.
Register
menu for the Register window
Figure 47:
Register menu
Edit
This menu item has the same effect as double clicking
a register. The content of the selected register may be changed. This menu
item is only active when a register has been selected.
Format
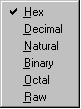
This menu item calls another pop-up menu, as shown in
Register format menu,
allowing the content of the selected register to be displayed in Hexadecimal,
Decimal, Natural,
Binary, Octal,
and Raw formats.
Remove from Display
This menu item removes the selected register from the
window. All registers are displayed if the window is closed and reopened.
This menu item is only active when a register has been selected.
Display All Registers
This menu item displays all the registers. This menu
item is only active when one or more registers have been removed from display.
Figure 48:
Register format menu
Hexadecimal
(Hex) is the default display format.
Remove
from Display
This menu item removes the selected register from the
window. All registers are displayed if the window is closed and reopened.
This menu item is only active when a register has been selected.
Display
All Registers
This menu item displays all the registers. This menu
item is only active when one or more registers have been removed from display.
Memory
window
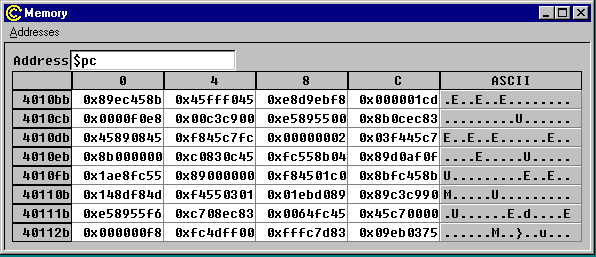
The Memory window,
as shown in Memory
window, dynamically displays the state of memory.
Figure 49: Memory window
A memory location
can be selected by double clicking the left mouse button with the cursor
in the window. The contents of a selected memory location can be edited.
Single clicking on an expression
selects that expression.
Right clicking in the display
pane, while an expression is selected, calls an expression-specific Watch menu,
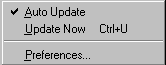
as shown and described with Watch
menu in the Watch Expressions window.
Figure 53: Watch
menu in the Watch Expressions window
Figure 54: Watch
menu for the Watch Expressions window
Edit
Allows the value in the expression to be edited.
Hitting
the escape key (Esc)
will abort the editing.
Format
This menu item brings up another pop-up menu, as shown
in Value formats for the Watch
Expressions window, allowing the value of the selected expression
to be displayed in Hexadecimal, Decimal,
Binary, and Octal
formats.
Figure 55: Value formats for the
Watch Expressions window
By
default, pointers are displayed in hexadecimal and all other expressions
are displayed as decimal.
Remove
Removes the selected expression from the watch list.
Figure 56
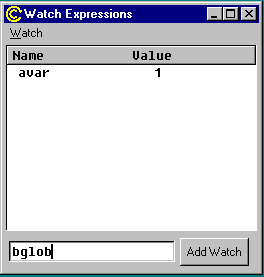
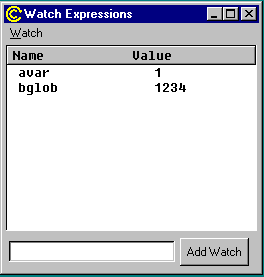
: Using the Add Watch button
for the Watch Expressions window
Watching
registers with the Watch Expressions window
GDB allows registers
to be added to the Watch
Expressions window, by typing register convenience variables
into the text edit field. Every register has a corresponding convenience
variable. The register convenience variables consist of a dollar sign followed
by the register name. The convenience variable for the program counter
is $pc, for example.
The convenience variable for the frame pointer is $fp.
Casting pointers
in the Watch Expressions window
Pointer values
may be cast to other types and watched, represented as the type to which
the pointer was cast. For example, by typing "(struct
_foo *) bar" in the text edit field, the bar pointer is cast
as a struct _foo pointer.
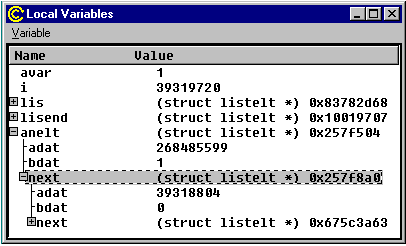
Local
Variables window
The Local
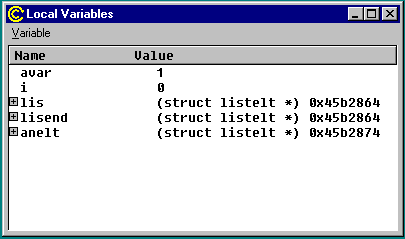
Variables window displays the current value
of all local variables.
Figure 57: Local Variables window
Single clicking the mouse with
the cursor over a variable selects the variable.
Double clicking the mouse with
the cursor in the Local Variables window
puts the variable into edit mode.
Single clicking the mouse with
the cursor on the minus sign to the left of an open structure closes the
display of the structure elements.
Figure 58: Displaying the elements
of a variable structure
Variable menu for
the Local Variables window
Figure 59:
Variable menu for the Local
Variables window
Edit
Allows the value of a selected variable to be edited.
Hitting the Escape key (Esc)
will abort the editing.
Format
This menu item brings up another pop-up menu, as shown
in Variable
format menu, allowing the value of the selected variable to
be displayed in the Hexadecimal, Decimal,
Binary and Octal
formats.
Figure
60: Variable format menu
By
default, pointers are displayed in hexadecimal and all other expressions
are displayed as decimal.
Single clicking with the mouse
with the cursor over a check-box for the information displayed for a breakpoint
selects that breakpoint.
Single clicking with the mouse
with the cursor over a checked check box of a breakpoint disables the breakpoint.
The check disappears and the red square in the Source
Window turns black.
Single clicking with the mouse
with the cursor over an empty check box of a disabled breakpoint re-enables
the breakpoint. The check reappears and the black square in the Source
Window turns red.
Breakpoint menu
for the Breakpoints window
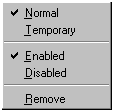
Figure 62: Breakpoint
menu for the Breakpoints window
Normal
Temporary
This pair of menu items toggles between the normal and
temporary setting of the selected breakpoint. A normal breakpoint remains
valid no matter how many times it is hit. A temporary breakpoint is removed
automatically the first time it is hit. A single check mark for either
setting shows the state of the selected breakpoint.
When
a breakpoint is set to temporary the red check mark in the check box and
the red square in the Source
Window turn orange, as shown by comparing Breakpoints
window with Results of setting
breakpoints.
Figure 63: Results of setting
breakpoints
Enabled
Disabled
This pair of menu items toggles the enabled or disabled
state of the selected breakpoint. The single check mark between them shows
the state of the selected breakpoint.
Remove
This menu item removes the selected breakpoint.
Global menu for
the Breakpoints window
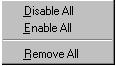
Figure 64: Global
menu for the Breakpoints window
Disable
All
Disables all breakpoints.
Enable
All
Enables all breakpoints.
Remove
All
Removes all breakpoints.
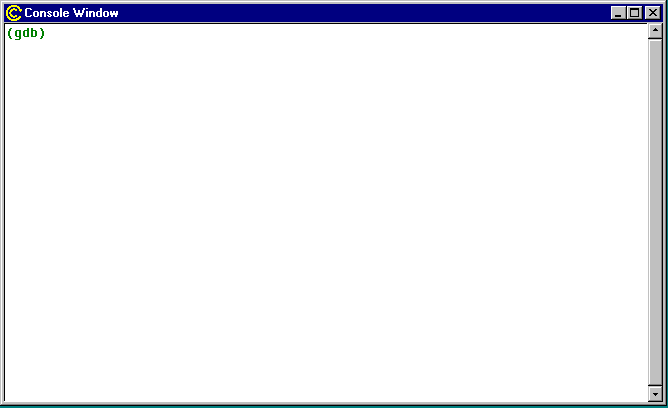
Console
window
The Console
window contains the command prompt for GDB, the GNUPro debugger,
allowing access to the debugger through the command-line interface. (gdb)
is the prompt for the debugger.
Figure 64: Console window
Note: The Console window is different from the cconsole window
for the Windows operating system (which is known as the Command.com
window).
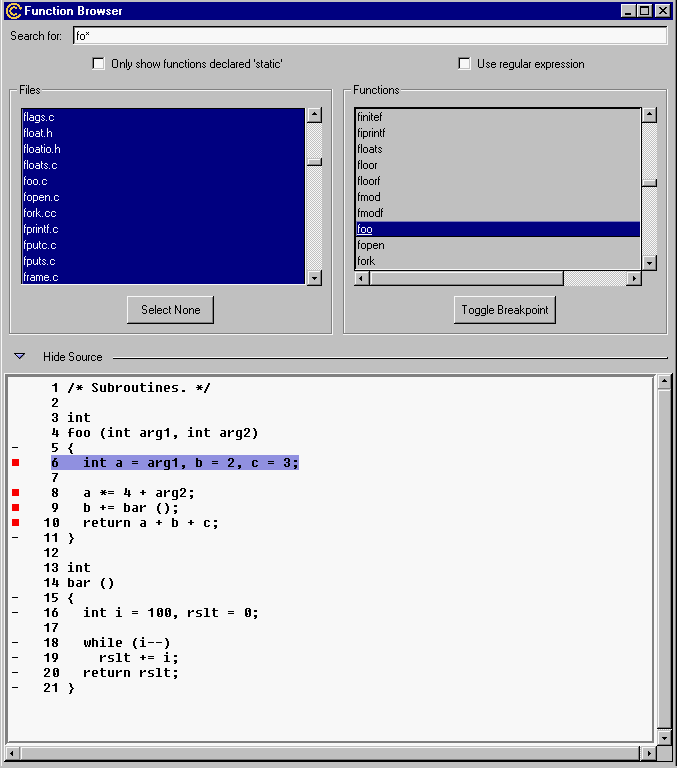
Makes search routines use regular expression matching.
For example, searching for my_func,
without using regular expressions, will match my_func_1,
not this_is_my_func, while the regular
expression, my_func, matches both my_func_1
and this_is_my_func regular expressions.
Files
Limits the search to the highlighted files. If no files
are highlighted, all files are searched. Clicking individual file names
selects or deselects that file.
Select None/Select
All
Toggles between Select All
and Select None, switching whenever activated,
for selecting all files or none. Useful when searching all files except
one or two specific files, or limiting searches to a small group of individually
selected files.
Functions
Matches functions in the selected file(s). Right-click
on a function to toggle a breakpoint on it.
Figure 66: Function Browser window
with source browser
Help
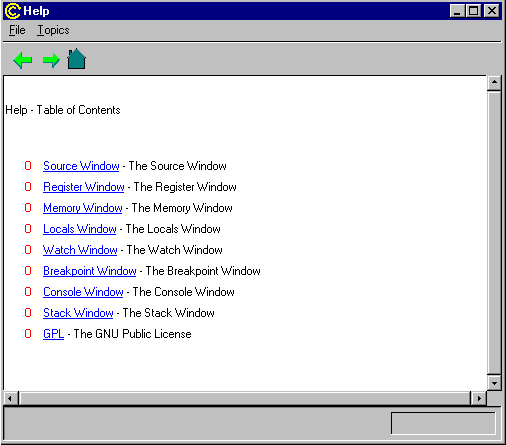
window
The Help
window is invoked by clicking the Help Topics
menu selection in the Help drop-down menu
of the Source Window. The Help
window offers HTML based navigable help by topic.
Figure 67:
Help window
Note: There is currently no Help topic for the Function
Browser window, since the implementation of the Function
Browser window is new to Insight functionality.
Each menu item
represents a help topic. When a menu item is selected, the content of the
Help window changes to reflect the listed
topic. There is currently no Help topic for the Function
Browser window, since the implementation of the Function
Browser window is new to Insight functionality.